
Every spring at 213 we gather a whole bunch of projections for players and average them together to see what a conglomerate of baseball sources think a given player will perform over the year. It’s wholly unscientific – averaging averages and not weighting them for previous accuracy or amount of playing time they feel a player will see.
Before the 2018 season, the Mets weren’t sure that Nimmo was a starter, and messed with his playing time early. He ended 2018 with a 123 DRC+, which was highest by a Mets batter that year. 2019 started off a bit the same for Nimmo, the consensus was that he was a starter but there was a debate about his defensive ability. He also got started off to a rough start to which we later found out that he was playing with a bad back. So he missed quite a bit of playing time but performed well once he returned. The projections below were originally posted/discussed here and they are followed by his 2019 stats:
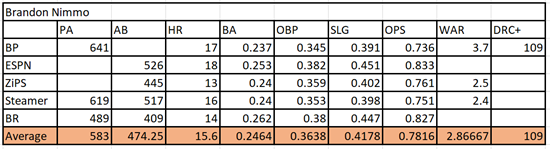
2019 Stats: 254 PA< 199 AB, 8 HR, .221/.375/.407, 0.9 WAR, 100 DRC+
Again, lets remember that Nimmo started the season horribly, so coming back to still post almost a full point of WAR, to still beat his projections for OBP (which is what made his 2018 season so special) is a massive accomplishment.
Baseball Reference and ESPN were the most bullish on Nimmo’s OBP (and ESPN tends to be bullish about everything), so feels like a win for Baseball Reference (assuming that Nimmo’s drop in power was injury related). ZiPS was the closest for OPS, but they accomplished that by over-projecting power and batting average and under-projecting Nimmo’s walk rate.
We love Brandon Nimmo. We cannot wait to see what he does in another full season if he is completely healthy. We are also curious as to how computer projections going into 2020 handle Nimmo with his injuries in 2019 and projected health.


